
YouTube Video Retention: How to Stop Viewers from Clicking Away
Estimated reading time: 16 minutes
Introduction
Here is an uncomfortable truth most YouTube tutorials skip over: views are vanity metrics. They feel great in a screenshot, but they tell you almost nothing about whether your content is actually working.
What matters, what the YouTube algorithm genuinely rewards, is whether people watch your video. Not just click on it. Watch it. Stick around. Come back.
That is where YouTube video retention enters the picture, and it is arguably the single most important performance signal on the platform. When viewers stay on your video, YouTube sees that as a quality signal and pushes your content to more people. When they bail after 20 seconds, the algorithm notices that too, and quietly buries your upload.
The good news is that retention is not some mysterious black box. It is a learnable skill, built on understanding human psychology, tight editing, and strategic content structure. Whether you are getting 200 views per video or 200,000, the same principles apply.
This guide breaks down exactly what drives audience retention on YouTube, how to read the signals your analytics are already giving you, and the specific tactics you can use today to keep viewers watching longer.
1. Why YouTube Video Retention Matters More Than Views
YouTube’s recommendation system is built around one core idea: keep people on the platform as long as possible. The longer viewers stay on YouTube because of your content, the more valuable you are to the platform as a creator.
According to YouTube’s own Creator Academy documentation, watch time and audience retention are among the primary signals the platform uses to surface videos in search results, the homepage feed, and the “Up Next” sidebar. A video with 10,000 views and 60% retention will almost always outperform a video with 50,000 views and 20% retention, in terms of long-term reach and distribution.
Think of it this way. YouTube is essentially running a continuous experiment to find the content that earns viewer attention most efficiently. Your retention rate is your score in that experiment.
Retention also feeds into two related metrics that matter:
- Average view duration: The actual number of minutes and seconds people spend watching your video on average
- Click-through rate (CTR): While technically a separate metric, CTR and retention work together. A high CTR with poor retention signals a misleading thumbnail or title, which damages trust with both viewers and the algorithm
The relationship is symbiotic. Improve retention, and everything else tends to follow.
2. Understanding Your Audience Retention Graph
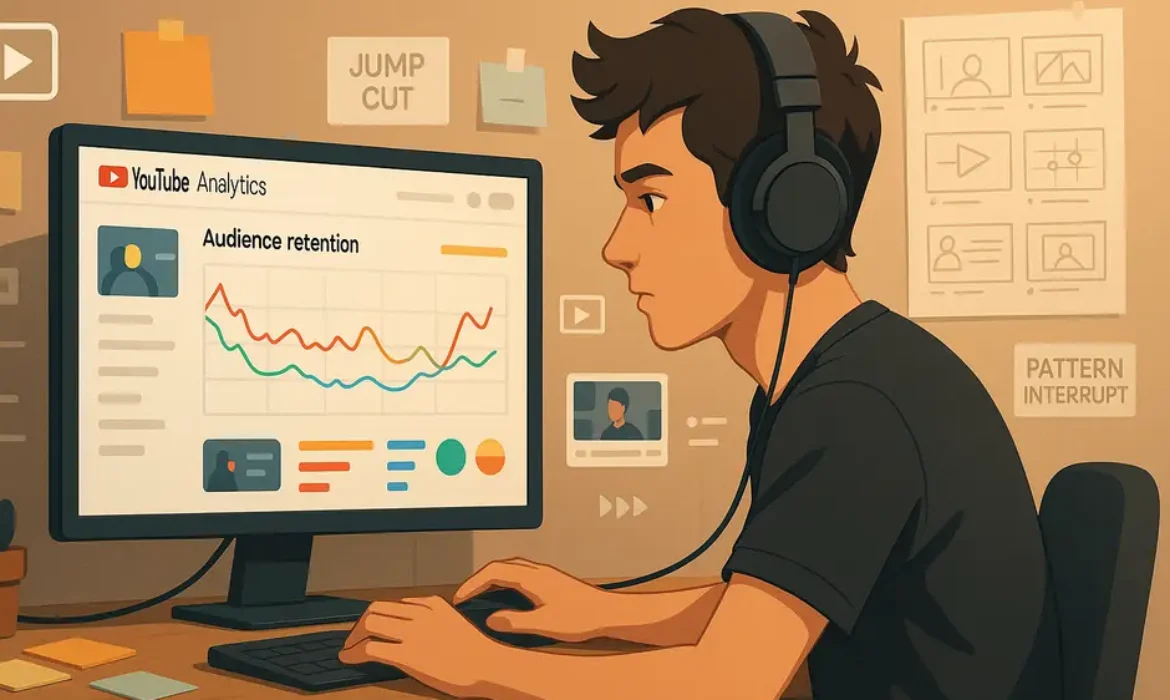
Before you can fix a retention problem, you need to know exactly where it exists. YouTube Analytics gives you a remarkably detailed view of this through the audience retention graph, a visual representation of where viewers drop off, rewatch, or stay engaged throughout your video.
To find it: navigate to YouTube Studio, select any video, click on the Analytics tab, and scroll to the “Engagement” section. The retention graph will show you a line that ideally stays as flat and high as possible across the video’s entire length.
Here is what to look for:
| Pattern | What It Means |
|---|---|
| Sharp drop in first 30 seconds | Hook is not landing; intro is too slow or unclear |
| Gradual steady decline | Normal baseline; video is engaging but not exceptional |
| Sudden cliff at a specific timestamp | A specific segment is losing viewers fast |
| Bumps or spikes (graph goes up) | Viewers are rewatching that section |
| Relatively flat line throughout | Excellent retention; highly engaging content |
The spikes are particularly interesting. When viewers rewind and rewatch a section, it usually means one of two things: the content was genuinely useful or impressive, or something was unclear and they needed to hear it again. Either way, those moments are worth analyzing.
The cliff drops are your most urgent problems. If 40% of your audience leaves at the 2-minute mark, something specific is happening there. Maybe a long-winded explanation, an awkward transition, a rambling tangent, or a tonal shift that breaks the momentum.
YouTube also provides a comparative retention benchmark that shows how your video performs relative to similar-length videos on the platform. This is incredibly useful for calibrating your expectations and understanding whether a 45% retention rate for a 20-minute tutorial is strong or weak in your specific niche.
3. The Hook: Your First 30 Seconds Are Everything
The single highest-leverage moment in any YouTube video is the opening. According to data shared by various top creators and corroborated by YouTube’s internal research, the steepest drop-off consistently happens within the first 30 to 60 seconds. That window is where you either earn a viewer’s continued attention or lose it permanently.
A strong YouTube hook does three things simultaneously:
- Establishes what the video is about with total clarity
- Creates a reason to keep watching (curiosity, promised value, or unresolved tension)
- Moves fast, getting into substance before the viewer’s patience expires
The most effective hook formats include:
The Problem-First Open: Start by naming the exact pain point your viewer is experiencing. “If your YouTube videos keep losing viewers in the first two minutes, you are probably making one of these five mistakes.” That sentence speaks directly to someone searching for retention advice. They feel seen immediately.
The Surprising Statistic: Lead with a counterintuitive or jarring piece of data that reframes the topic. “Most YouTube creators obsess over view counts, but the metric that actually determines your channel’s growth is something almost no one optimizes.”
The Bold Claim: Make a specific, credible promise. “By the end of this video, you will know exactly why your retention is dropping and what to fix first.”
The Cold Open (In Media Res): Drop viewers directly into a compelling moment, a result, a demonstration, a transformation, without preamble or intro sequences. Skip the “don’t forget to subscribe” opener entirely. That kills momentum and signals to new viewers that you are prioritizing your own metrics over their experience.
What you want to avoid in those first 30 seconds: lengthy channel intros with animation and music, excessive recapping of what the video “will cover,” and slow-building introductions that assume viewers already trust you enough to wait.
They do not. Not yet. Earn it first.
4. Video Pacing and Why Slow Content Gets Punished
Pacing is one of the most underrated elements of audience retention on YouTube, and it is also one of the hardest to self-diagnose because it requires you to watch your own content as a stranger would.
Pacing refers to the rhythm and speed at which your content moves forward. A video with poor pacing feels like it is killing time. A video with strong pacing feels like every second is earning its place.
Several factors affect pacing:
Speaking speed and dead air. Long pauses, frequent “ums” and “uhs,” and slow delivery all signal low energy. This does not mean you need to speak at an unnatural sprint, but your delivery should feel intentional and propulsive. In editing, cutting out dead air between sentences, even just 0.1 to 0.3 seconds per instance, accumulates into a noticeably tighter video.
Information density. Are you spending 90 seconds explaining something that could land in 30? Padding content to hit a target length is one of the most common and most damaging pacing mistakes. Viewers are acutely sensitive to filler, even if they cannot articulate it.
Transitions between sections. Abrupt or poorly signaled transitions can disorient viewers. But over-long connective tissue (“So, now that we have covered X, let us move on to Y, which is going to be really important because..”) exhausts patience. Aim for clean, brief transitions that maintain momentum.
Sentence structure in scripting. If you script your content, vary your sentence lengths deliberately. Long, complex sentences with multiple subordinate clauses and conditional phrases create cognitive drag. Short sentences hit hard.
Good pacing is invisible. Viewers do not notice it. They just find themselves still watching at the 10-minute mark without quite knowing why.
5. Pattern Interrupts: The Secret to Keeping Viewers Locked In
The human brain is wired to notice change. When something stays the same for too long, attention drifts. This is not a character flaw in your audience. It is neuroscience.
Pattern interrupts are intentional changes in stimuli designed to reset attention. On YouTube, they function as small recalibrations that keep the brain engaged without requiring the viewer to make a conscious effort.
Effective pattern interrupts include:
- B-roll footage that illustrates or complements what is being said on screen
- Jump cuts that trim micro-pauses and maintain visual energy
- Text overlays and graphics that highlight key points
- Camera angle or framing changes between or within sections
- Music or sound design shifts that signal transitions
- Screen recordings, demonstrations, or examples that break up talking-head segments
- Callouts or visual emphasis on important numbers or phrases
A general rule of thumb many successful creators follow is to introduce some form of visual or auditory change every 20 to 30 seconds. This does not mean your editing has to be frantic or overwhelming. It simply means you are giving the brain something new to process at a regular interval.
B-roll, in particular, is worth treating as a primary creative asset rather than a decorative afterthought. Well-chosen B-roll does double duty: it illustrates your point and provides visual variety simultaneously. Channels like Kurzgesagt, Veritasium, and Mark Rober have built massive audiences in part because their visual pacing is relentlessly considered.
6. Editing Techniques That Reduce YouTube Drop-Off
The editing room is where retention problems are solved or created. Here are the specific techniques that consistently move the needle on reduce YouTube drop-off:
Jump cuts: Cutting between takes to remove pauses, stumbles, or unnecessary words. Done well, jump cuts tighten delivery without feeling choppy. Done poorly, they are jarring. The key is consistency of eyeline and framing across cuts.
L-cuts and J-cuts: These audio-video overlap edits (where the audio of one clip continues over the visuals of the next, or vice versa) create a more cinematic, fluid feel. They smooth transitions and make the video feel professionally produced even on a modest budget.
Chapter markers: YouTube allows creators to add timestamps in video descriptions that automatically generate chapters. These are not just viewer conveniences. They reduce drop-off by letting viewers navigate to sections they care about most, which can actually increase total watch time by encouraging selective engagement rather than wholesale abandonment.
Zoom and reframe: Rather than cutting to a different angle (which requires multiple cameras), editors can push in or out on a single shot to create visual variety. Modern editing software handles this cleanly at typical YouTube resolutions.
Color grading consistency: A jarring shift in color temperature between clips breaks immersion. Consistent grading keeps the visual experience smooth and professional, which sustains viewer trust.
Removing tangents in post: Every video has moments where the creator went on a detour, a slightly off-topic anecdote, an over-long explanation, a repeated point. Ruthless editing of these moments consistently improves retention graphs. If a segment does not directly serve the viewer’s reason for watching, it should be cut.
One framework to apply during editing: watch each section and ask, “Would someone who came specifically for this topic still be interested in this moment?” If the answer is no, the moment needs to go.
7. How to Structure Your Video for Maximum Watch Time
Retention is not just about what you do in the first 30 seconds or how tight your editing is. The overall architecture of your video determines how naturally viewers move from beginning to end.
A proven structure for high-retention YouTube content:
Hook (0–30 seconds): State the core promise and create a reason to stay.
Credibility setup (30–90 seconds): Briefly establish why you or this video is worth listening to. Do this through demonstrated knowledge, not credential listing.
Content payoff in digestible chunks: Break the meat of your content into clearly named sections. Use verbal signposts (“Here is the second thing most creators get wrong”) to help viewers track where they are in the video.
Callbacks and internal curiosity loops: Tease something earlier in the video that you will deliver on later. “We will get to the single biggest retention mistake at the end, and it is one almost nobody talks about.” This is the content equivalent of a narrative cliffhanger. Viewers stay because they are waiting for the payoff.
Strong ending: Too many YouTube videos simply stop. They finish their last point and say “that is everything.” A strong close recaps the key insight, reinforces the value delivered, and gives viewers a clear next action without begging for it.
Avoid the “outro sag.” Retention graphs almost universally show a decline in the final 15–20% of a video. This is expected behavior, but you can soften it by keeping the content substantive all the way to the final sentence. Do not front-load all your value and coast to the finish.
8. Using YouTube Analytics to Diagnose Retention Problems
YouTube Analytics is one of the most underused tools in most creators’ workflows. Here is a practical framework for using it systematically to improve average view duration and reduce drop-off.
Step 1: Identify your worst-performing videos by retention percentage. Sort by absolute retention rate in YouTube Studio. These are your case studies in what not to do.
Step 2: Pull up the retention graph for each underperforming video. Note the exact timestamps where significant drops occur. Write them down.
Step 3: Watch those timestamps with fresh eyes. Ask: What is happening in that moment? Is the pacing slow? Did the topic shift? Was there an ad placement? Is the information unclear?
Step 4: Cross-reference with your best-performing videos. Look for patterns. Do your highest-retention videos share a particular hook format, video length, or topic type? This is your creative data.
Step 5: Adjust one variable per batch of videos. Do not change everything at once. Isolate variables, such as hook style, intro length, or editing pace, and track the impact on retention graph shape over several uploads.
Useful YouTube Analytics metrics to track alongside retention:
| Metric | Why It Matters for Retention |
|---|---|
| Average view duration | Raw measure of how long people watch |
| Audience retention percentage | Relative measure compared to video length |
| Impressions click-through rate | High CTR with low retention signals title/thumbnail mismatch |
| Top traffic sources | Helps identify which audience segments retain best |
| Returning vs. new viewers | Returning viewers typically retain better |
9. Average View Duration Strategy: Setting Realistic Benchmarks
One of the most common mistakes creators make is benchmarking their retention against an arbitrary standard without accounting for video length or niche.
A 70% retention rate on a 2-minute video is respectable. A 50% retention rate on a 45-minute documentary-style deep dive might represent exceptional performance. Context matters enormously.
Here are general average view duration benchmarks to orient your expectations:
| Video Length | Strong Retention % | Average Retention % |
|---|---|---|
| Under 5 minutes | 60–70%+ | 45–55% |
| 5–15 minutes | 50–60% | 35–50% |
| 15–30 minutes | 40–55% | 30–40% |
| 30+ minutes | 35–50% | 25–35% |
These are approximate industry benchmarks based on data discussed in Tubics’ YouTube benchmarking research and creator-reported analytics shared across communities like r/youtube and YouTube Creator Summit sessions.
The goal is not to hit an arbitrary percentage. It is to be consistently above the benchmark for your video length and to improve your own historical average over time.
One practical strategy: experiment with video length deliberately. If your 20-minute tutorials consistently show a retention cliff at the 12-minute mark, you have data suggesting your optimal video length for that content type may actually be shorter. Let the analytics guide the editorial decision.
Key Takeaways
-
- YouTube video retention is the primary quality signal the algorithm uses to distribute content. High retention means broader reach
- The audience retention graph in YouTube Analytics tells you exactly where viewers are leaving and where they are rewatching. Use it systematically
- Your hook must work in the first 30 seconds. Lead with value, problem identification, or curiosity, never with channel intros or subscription requests
- Pacing determines whether viewers feel like every second of your video is earning their attention. Cut ruthlessly. Dead air kills momentum
- Pattern interrupts, including B-roll, jump cuts, text overlays, and visual changes, reset viewer attention every 20–30 seconds and prevent drift
- Video structure matters as much as content quality. Use curiosity loops, clear section signposting, and strong closings to carry viewers through
- Set retention benchmarks relative to your video length and niche, not to generic universal standards
- Test one variable at a time using YouTube Analytics data, and track the impact across multiple uploads before drawing conclusions
Frequently Asked Questions
1. What is a good YouTube video retention rate?
It depends heavily on video length. For videos under five minutes, anything above 60% is strong. For videos between 5 and 15 minutes, 50–60% is excellent. For longer content, 40–50% is competitive. The most useful benchmark is not an absolute number but how your retention compares to similar videos on the platform, which YouTube Analytics shows directly through its comparative retention feature.
2. How does YouTube video retention affect the algorithm?
YouTube’s recommendation system prioritizes content that keeps viewers on the platform longer. High audience retention signals to the algorithm that your video is satisfying viewer intent effectively, which leads to broader distribution across search results, the homepage, and the “Up Next” feed. According to YouTube’s own creator resources, watch time and engagement are foundational ranking signals.
3. Why do viewers drop off in the first 30 seconds of my video?
The most common causes are: a slow or unclear hook that fails to communicate the video’s value immediately; a lengthy branded intro that delays content; a mismatch between what the thumbnail or title promised and what the video actually delivers; and low production energy in the opening moments. Fix this by leading with your most compelling content first and cutting anything that does not serve the viewer’s reason for clicking.
4. Does video length affect audience retention percentage?
Yes, significantly. Longer videos naturally show lower retention percentages because holding attention for 30 minutes is inherently harder than holding it for 3 minutes. YouTube’s Analytics accounts for this by showing comparative retention data against similar-length videos. The right video length is the one that matches the genuine depth your content requires, not one optimized for a retention percentage in isolation.
5. What is the difference between audience retention and average view duration?
Audience retention is expressed as a percentage: the proportion of your video that the average viewer watches. Average view duration is the raw time figure, for example, 4 minutes and 32 seconds. Both appear in YouTube Analytics and together give a complete picture. A short video with 70% retention and a long video with 40% retention might produce similar average view durations. Tracking both metrics helps you understand performance across different content formats.
6. Do chapter markers actually help retention?
Yes, in a nuanced way. Chapter markers allow viewers to skip to relevant sections rather than abandoning the video entirely when they encounter a slow or irrelevant segment. This can maintain overall watch time even if some viewers skip sections. Chapters also signal to YouTube and to viewers that your content is well-organized and intentional, which builds trust. For longer videos especially, chapters are a strong best practice.
7. How often should I post to improve my retention metrics?
Posting frequency does not directly improve retention, but it creates more data points for analysis and more opportunities to apply lessons learned. Creators who publish consistently tend to improve retention faster because they iterate more quickly. However, posting low-quality content frequently purely for cadence will hurt retention metrics, not help them. Quality of execution matters far more than upload frequency when it comes to keeping viewers watching.
Conclusion
YouTube video retention is not a trick to chase. It is a craft to develop. The creators who consistently keep viewers watching are not doing anything magical. They are being rigorous about structure, pacing, hooks, and editing while staying deeply focused on the viewer’s experience from the first second to the last.
Your audience retention graph is one of the most honest feedback mechanisms in digital content creation. It shows you, without opinion or ego, exactly where your content is earning attention and where it is losing it. The creators who improve fastest are the ones who take that data seriously and use it to make sharper editorial decisions with every upload.
Start with your hook. Audit your last five videos using the retention graph. Identify one specific drop-off problem. Fix it in your next video. Then repeat the process.
Retention is built video by video, edit by edit, second by second. And every second you earn from a viewer is one the algorithm is watching too.
This article reflects current best practices based on YouTube’s publicly available creator documentation, platform-observed performance patterns, and editorial frameworks developed through extensive content strategy experience. For the most current algorithm guidance, consult the YouTube Help Center directly.